

How a Global Edtech Company Tripled Blog Pageviews and Beat Its Traffic Targets
At a glance
- Client: one of the top global edtech companies (corporate website)
- Engagement: over four years of SEO, AIEO, content, and paid media work
- Fiscal year: April 1 to March 31
- Blog pageviews: 3x increase over the engagement, without losing time on site or engagement rate (Google Analytics)
- FY 26 blog average: 1,605 pageviews per month against a target of 1,075 (Google Search Console data in an Excel table)
- AI-focused blog posts: a 500%+ increase in blog impressions in FY 26, with 46% more clicks (Google Search Console)
- Careers page: keywords on Google pages 1 and 2 rose 10x, and monthly pageviews peaked above 20,000
- LinkedIn ads: 2.03% click-through rate, compared with 0.32% under the previous agency
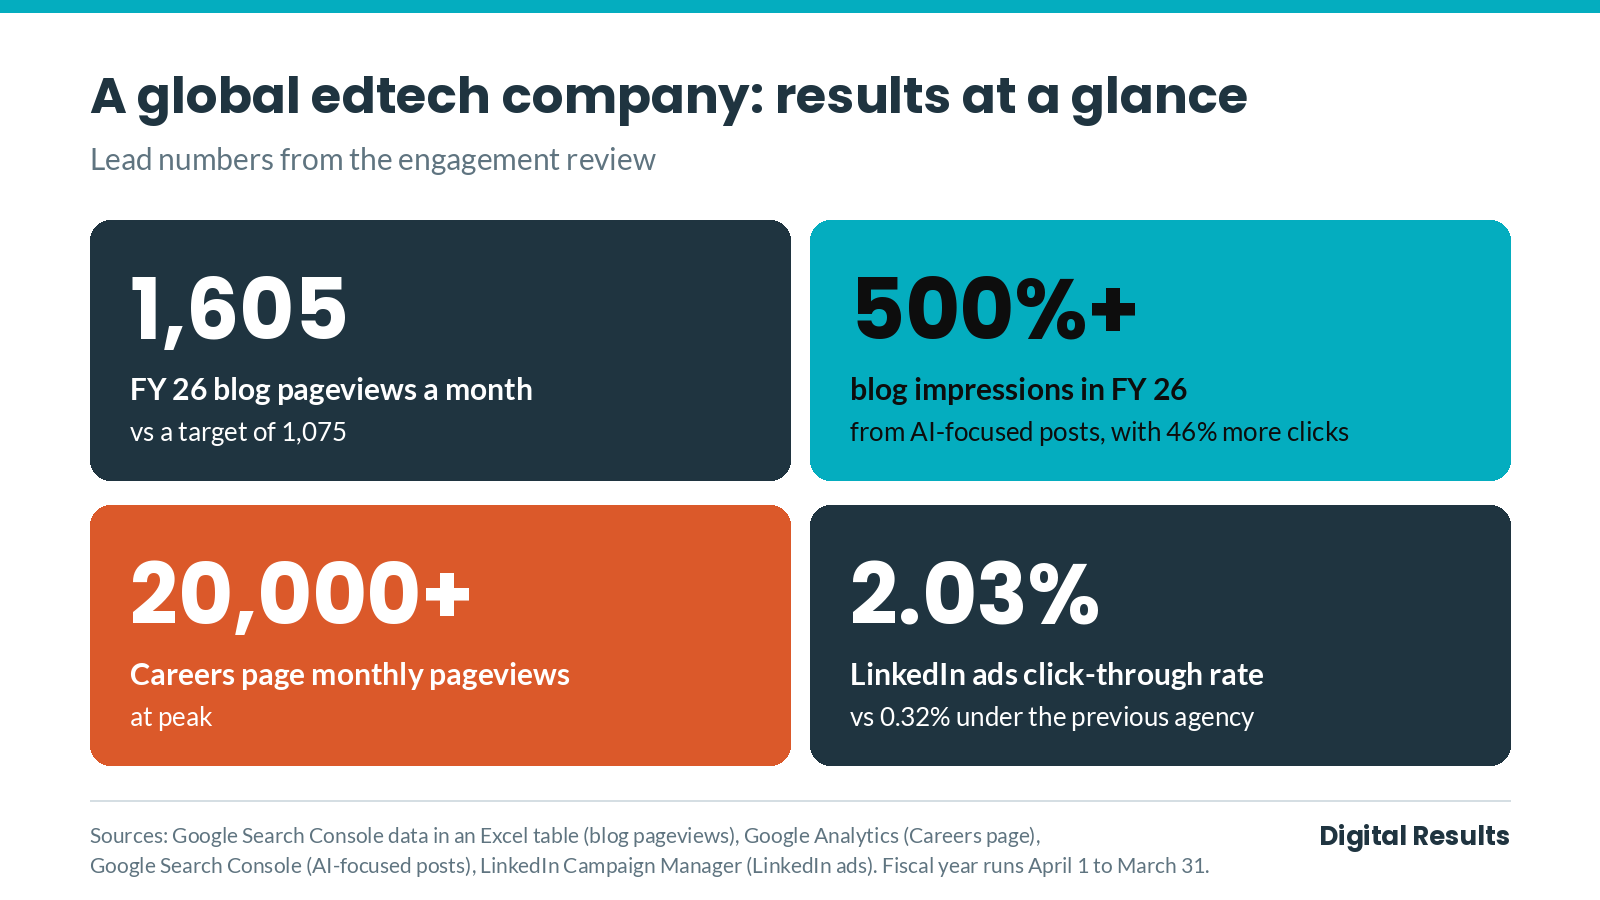
A global edtech company came to Digital Results to grow organic traffic to its corporate website. Over more than four years of work, its blog beat its traffic target in each of the last two fiscal years, its AI-focused content appeared in Google AI Overviews, and its investor ads earned a far higher click-through rate than they had under the previous agency.
What was the challenge?
The client needed its corporate site to reach more people through search while it published research, hired talent, and spoke to investors. The site supported several audiences at once: educators and readers of its research, job seekers, and the investment community. Each group searched in a different way, and the site had to answer all of them.
The company also set firm monthly pageview targets for its blog each fiscal year. That meant growth had to show up in reporting, not only in rankings.
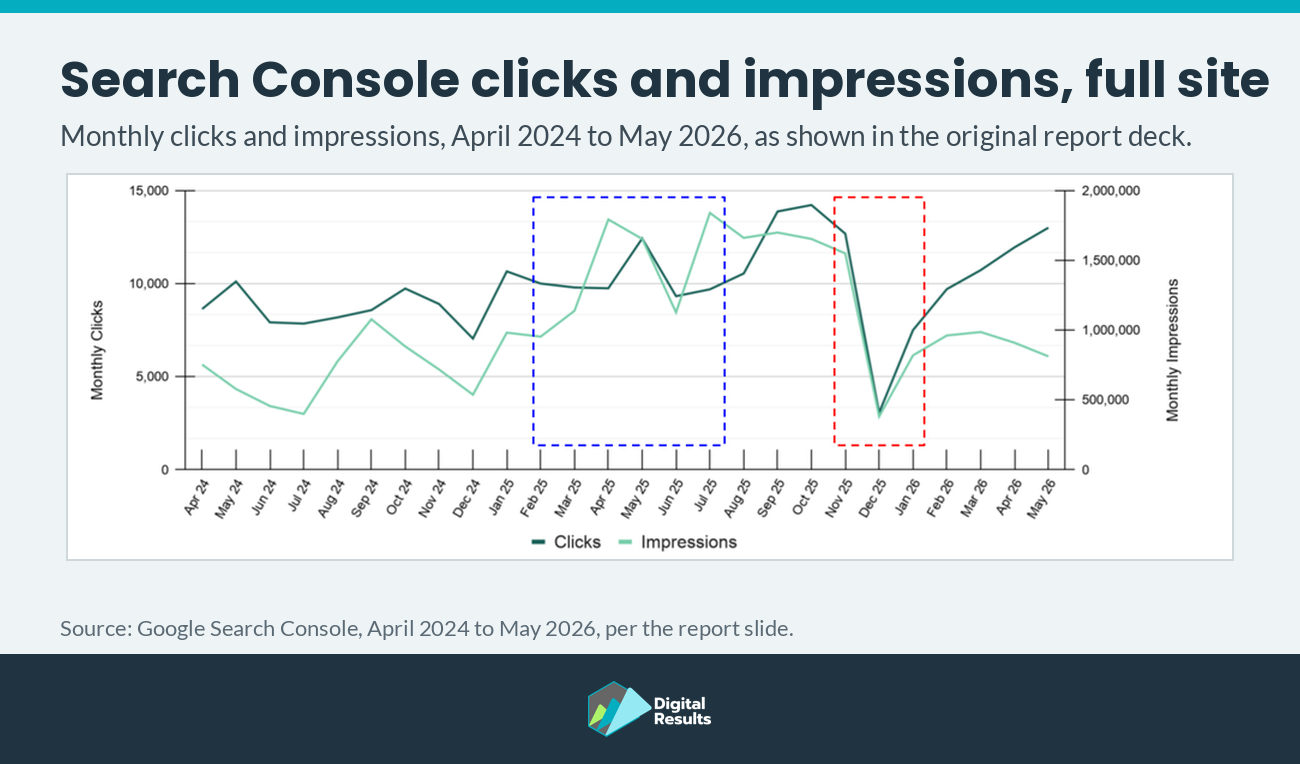
Partway through FY 26, the work faced a technical setback. From November 2025 to January 2026, a sitemap issue blocked search engines from crawling and indexing pages on the site. For about three months, new and updated content could not reach search results as it should.
What did Digital Results do?
We combined technical SEO, content, and paid media under one team. The work fell into four parts.
Technical SEO came first. We monitored crawling and indexing, found the sitemap issue, and worked with the client’s teams to restore indexing. We also supported the company through a rebrand and coordinated with its other agencies so search visibility held steady.
Next, we built the blog through keyword research and content. We improved existing blog posts and core pages and wrote new content for major research launches, including reports on AI in education and graduate employability. We wrote AI topics early, while search demand was still forming.
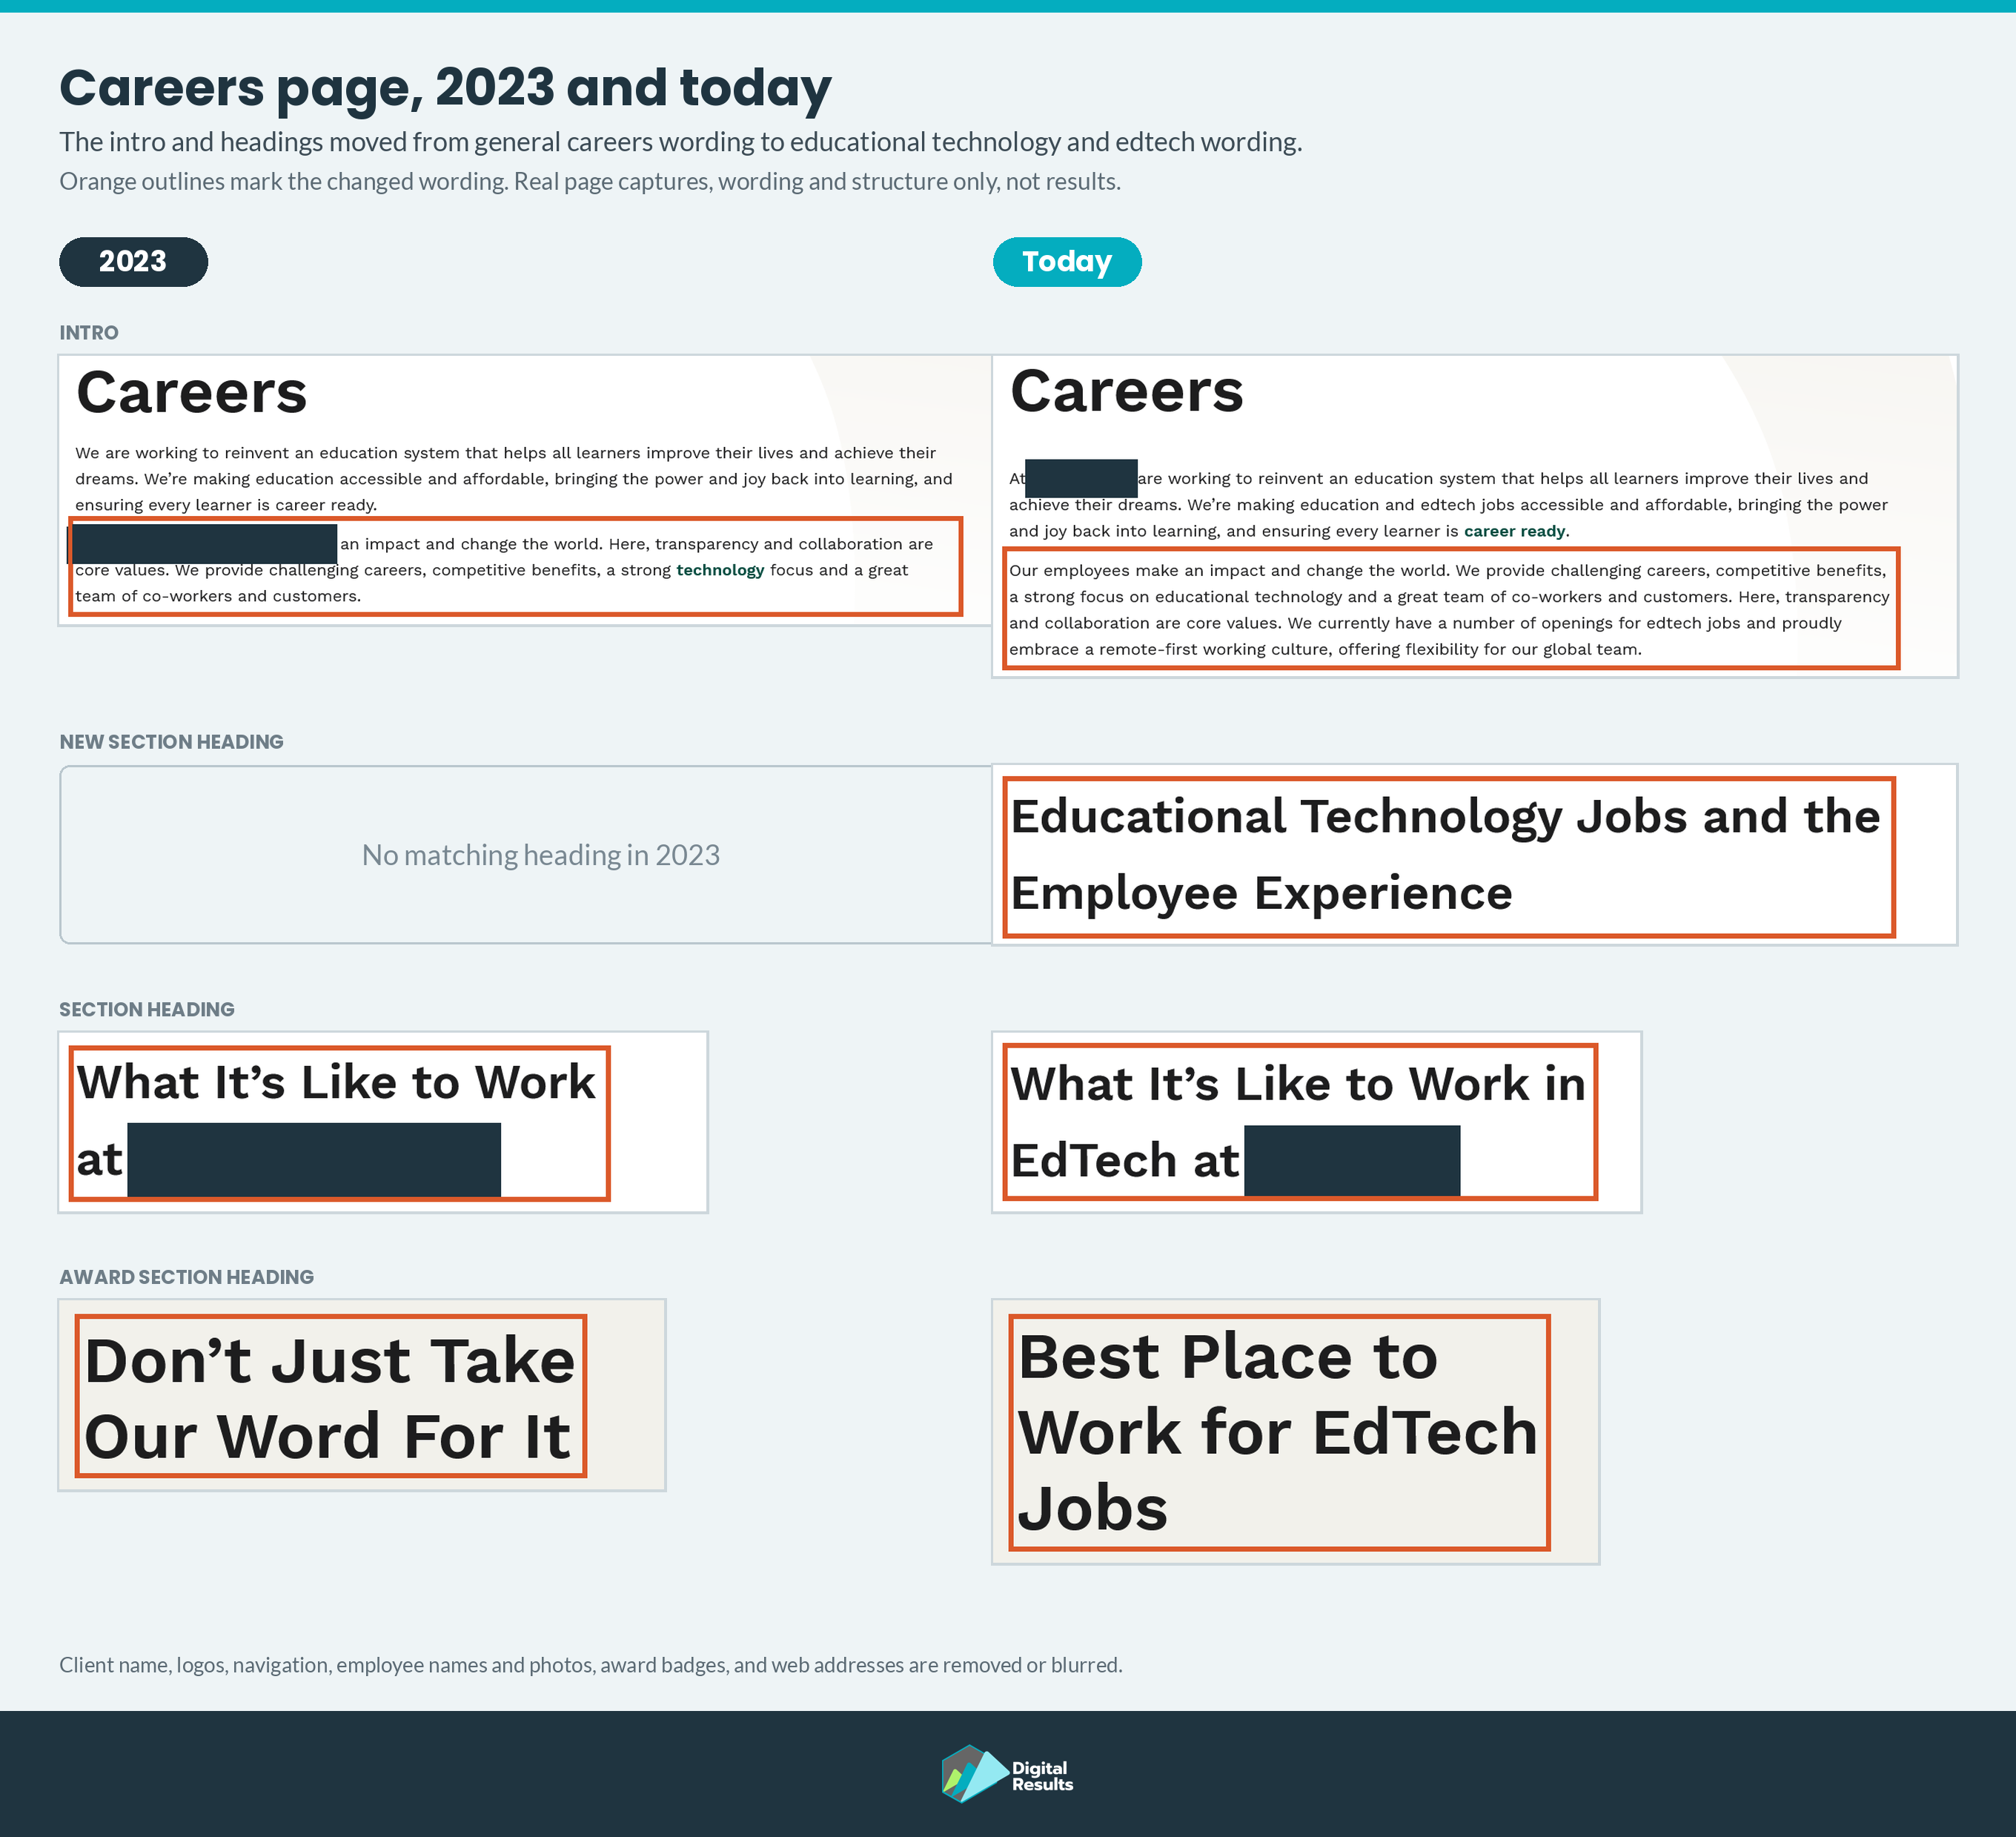
We also rebuilt the Careers page. Starting in late 2023, we reworked the page around the terms job seekers search for.
Finally, we took over investor-focused advertising on LinkedIn and Google from a previous agency. We updated existing content, built new landing pages, and refined targeting so the right audience saw the ads.
What results did the work produce?
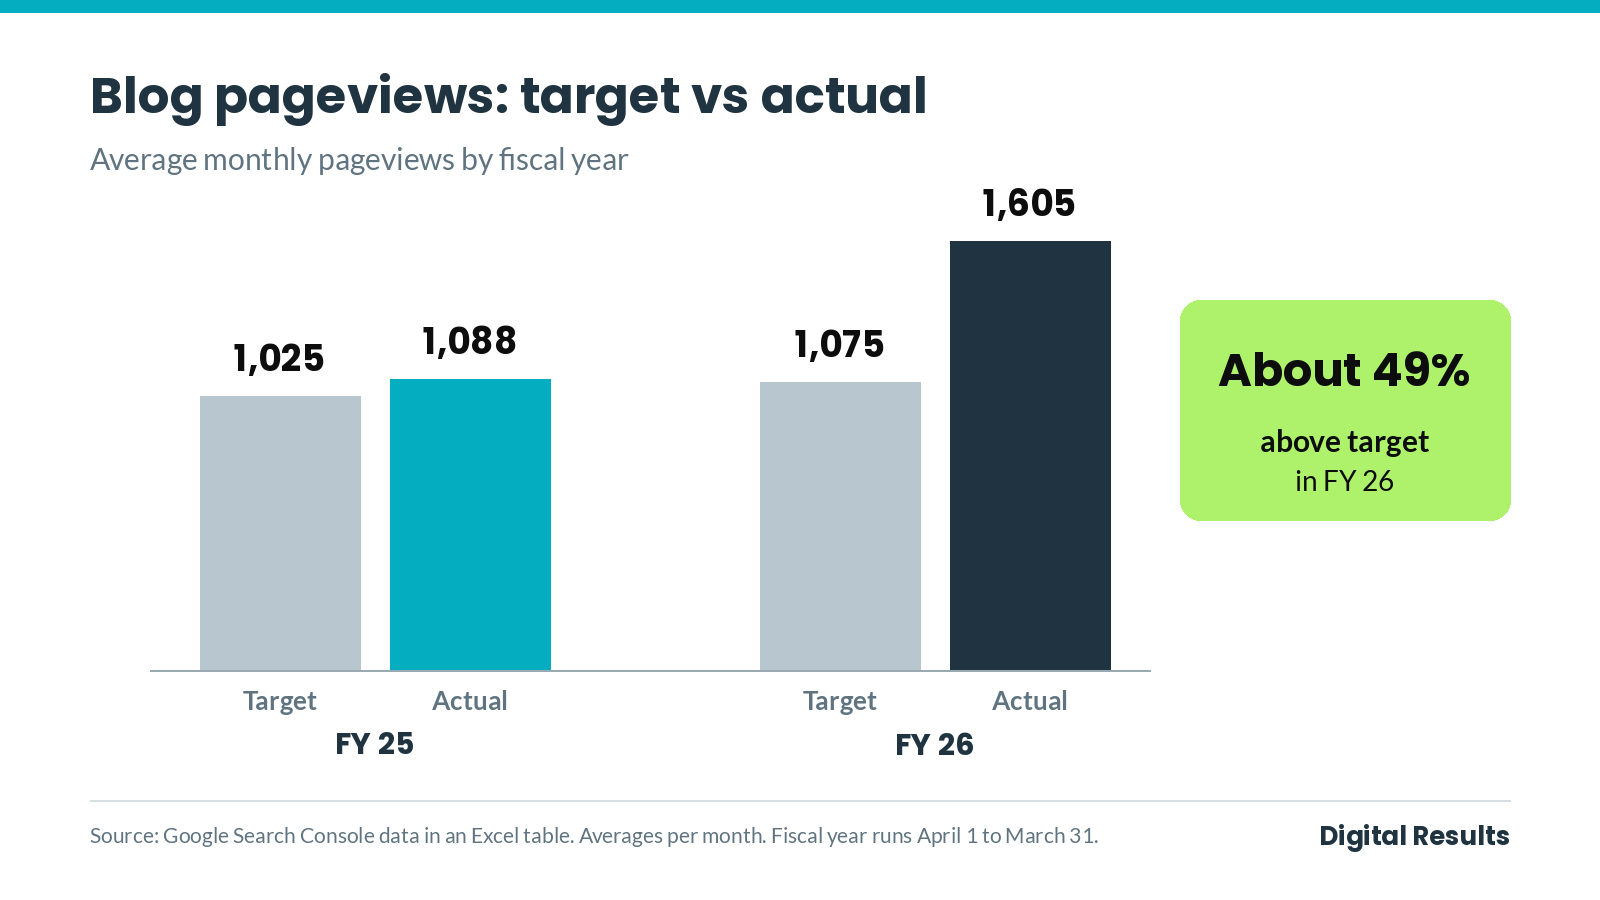
The blog beat its traffic target in each of the last two fiscal years. In FY 25, it averaged 1,088 pageviews per month against a target of 1,025. In FY 26, it averaged 1,605 pageviews per month against a target of 1,075, about 49% above goal (Google Search Console data in an Excel table). Across the engagement, blog pageviews grew 3x without any loss in time on site or engagement rate.
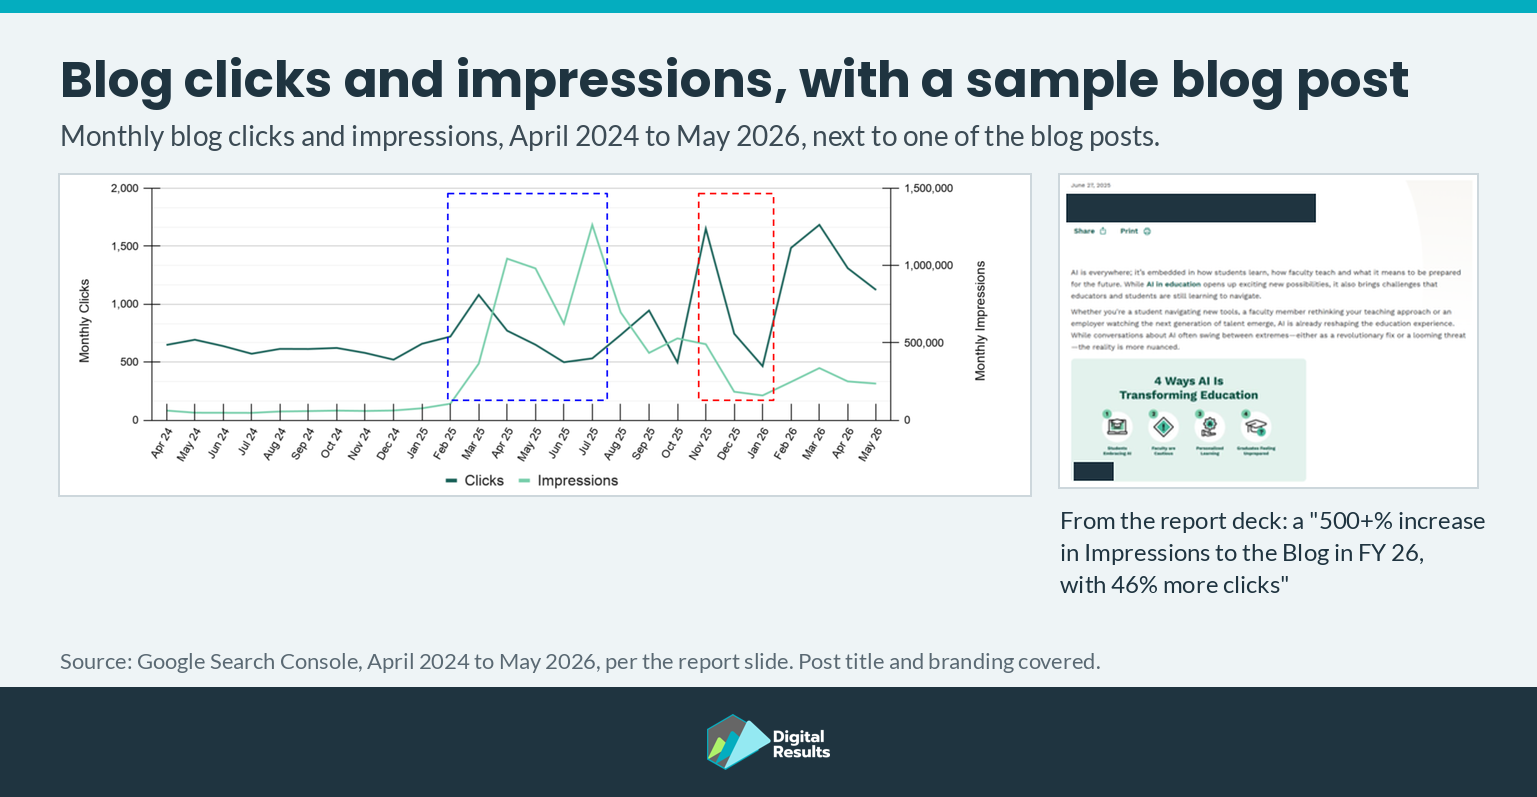
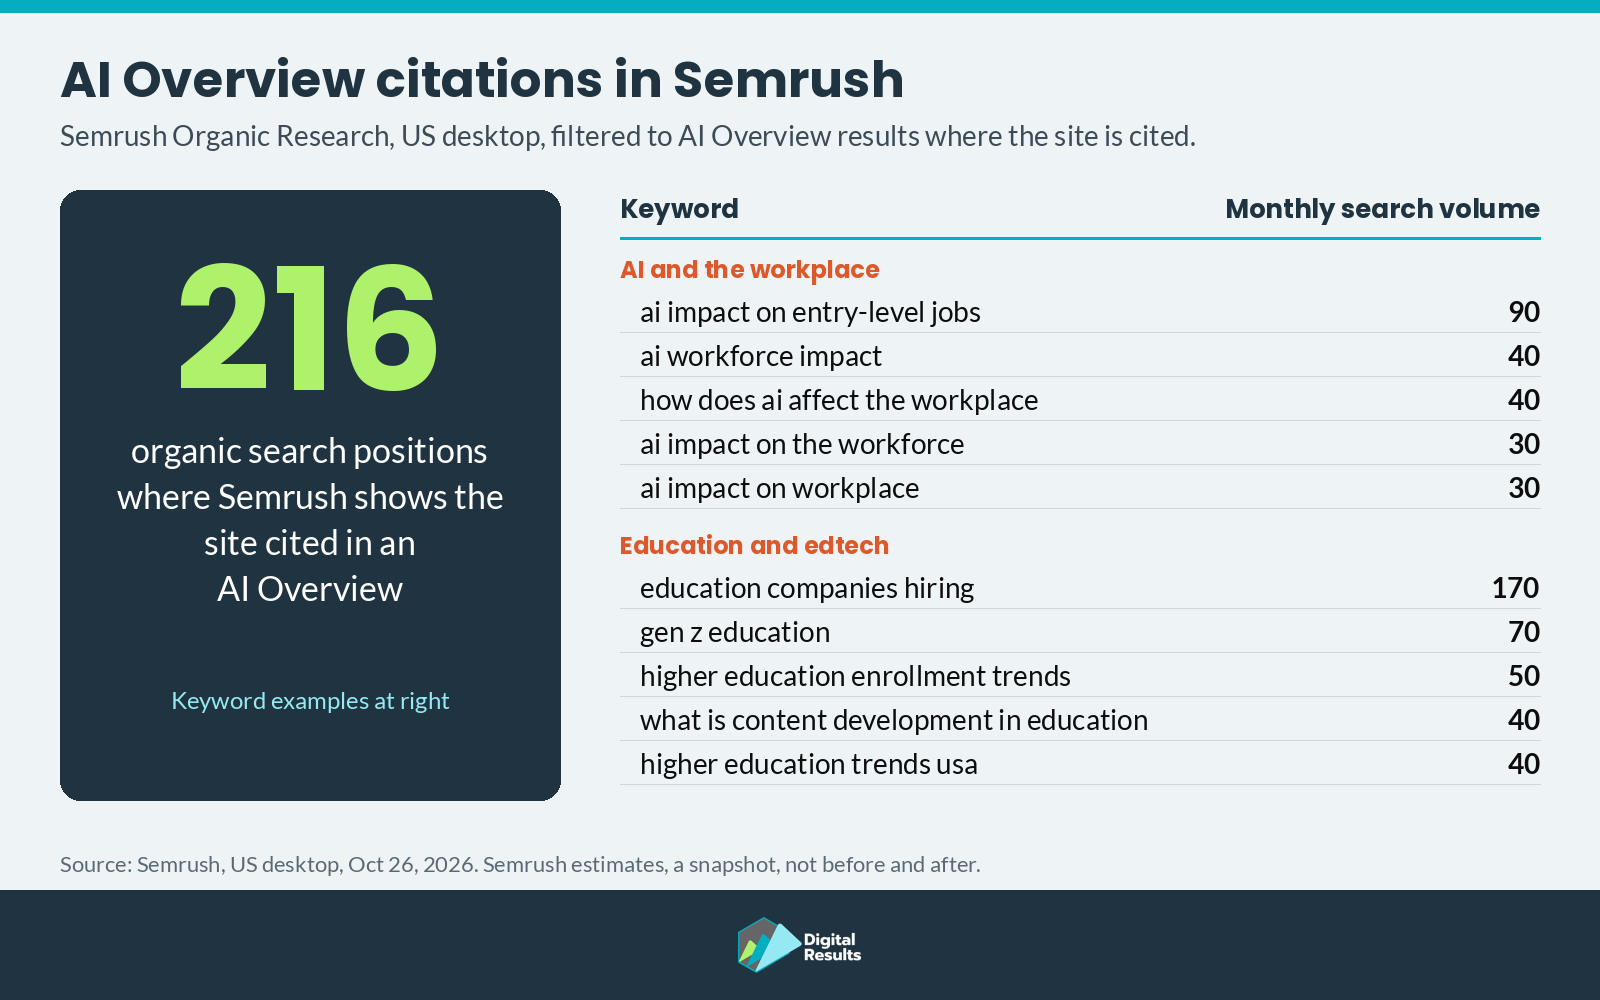
The AI-focused blog posts drove the biggest lift. In FY 26, they were responsible for a 500%+ increase in blog impressions and 46% more clicks (Google Search Console). Sitewide, clicks rose 15% in FY 26, even with the sitemap outage in the middle of the year. We also observed client pages ranking in the top three results for a competitive HR topic and appearing in multiple Google AI Overviews. These are observations from the period we tracked, not a guaranteed result.
The Careers page turned into a steady source of traffic. Keywords ranking on Google pages 1 and 2 rose 10x, and the page peaked at over 20,000 pageviews in a single month.
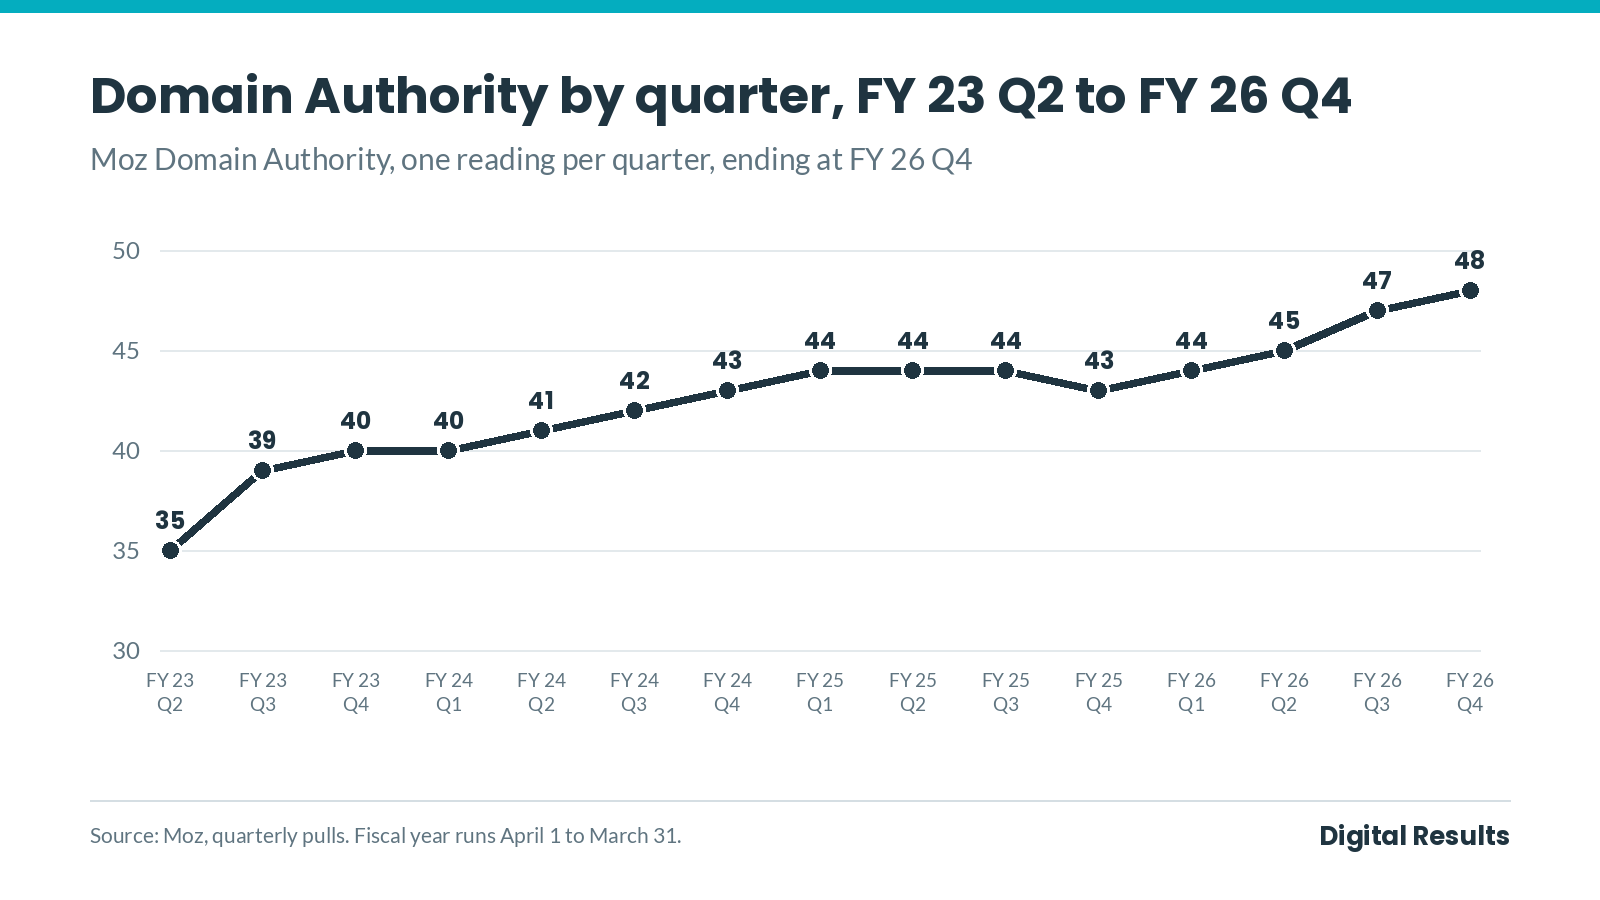
Across the full engagement, keyword rankings on page 1 of Google grew by 50%, and the site’s Domain Authority rose from 35 to 48, as measured by Moz.
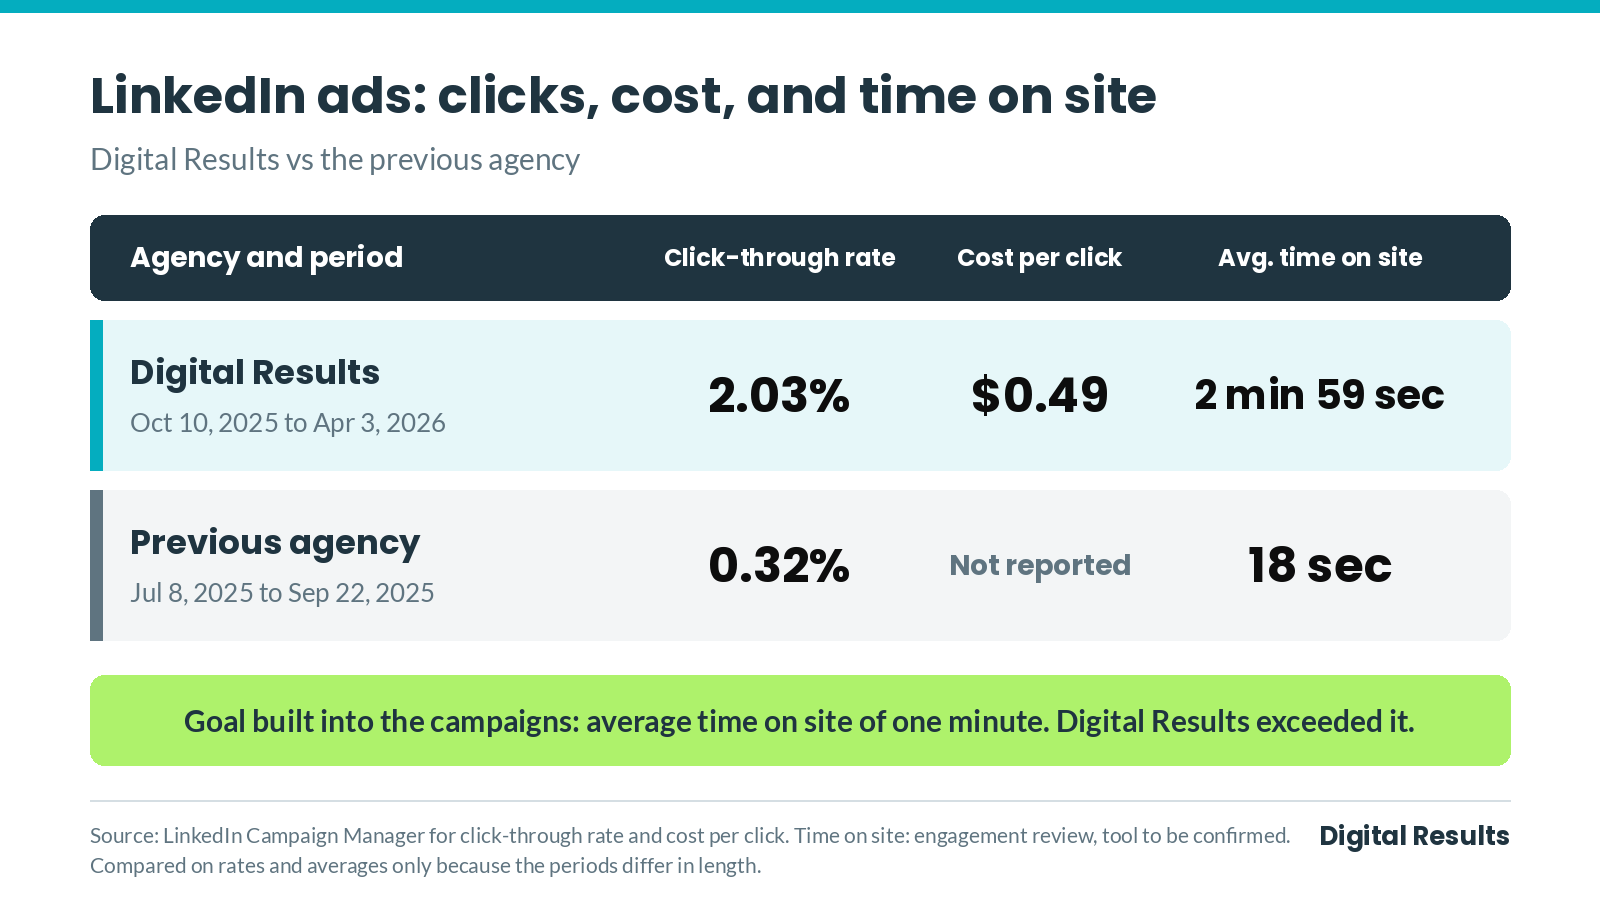
On LinkedIn, our campaigns from October 10, 2025 to April 3, 2026 earned a 2.03% click-through rate at $0.49 per click. The previous agency’s campaigns from July 8, 2025 to September 22, 2025 earned a 0.32% click-through rate (LinkedIn Campaign Manager). Our click-through rate is above the LinkedIn industry average, while the previous agency’s was below it. Time on site tells the same story. The previous agency’s campaigns averaged only 18 seconds on site, while ours averaged 2 minutes and 59 seconds. We measured average time on site against a one-minute goal that was built in as a conversion threshold, and our campaigns exceeded it. The ads also beat the KPIs set for engagement rate and for visits with two or more pageviews.
What comes next for this client?
The next phase builds on the content that performed best. We plan to keep writing answer-ready content on AI and education topics, since that content produced the largest gains in impressions and clicks. We will keep tracking which pages appear in AI search features and report what each platform shows.
We also plan to keep sitemap and indexing checks on a regular schedule, so an issue like the one in FY 26 is caught sooner. On paid media, the goal is to hold the higher click-through rate while testing new landing pages for investor audiences.
Frequently asked questions
How did AI-focused content affect organic traffic?
In FY 26, AI-focused blog posts drove a 500%+ increase in blog impressions and 46% more clicks, based on Google Search Console data. Some client pages also appeared in Google AI Overviews during the period we tracked.
How did the site hit its goal during the sitemap issue?
The sitemap issue blocked crawling and indexing from November 2025 to January 2026. We found the cause, worked with the client’s teams to restore indexing, and the blog still finished FY 26 at 1,605 average monthly pageviews against a 1,075 target.
Can Digital Results promise AI Overview placement?
No. No agency can promise placement in AI Overviews or other AI search features. We make pages eligible and easier to cite, and we report what each platform shows.
Why compare LinkedIn results on rates and averages only?
Our campaign period ran about six months, and the previous agency’s ran about two and a half. Total clicks and impressions are not a fair comparison across periods of different lengths, while click-through rate, cost per click, and average time on site are not tied to how long a campaign ran.
What this case study shows for your organization
Search growth for a large organization comes from steady work on several fronts at once. In this engagement, technical fixes kept pages indexable, early content on AI topics drew new impressions, and focused page rebuilds turned the Careers page into a traffic source.
If your organization wants the same mix of SEO and AIEO work, talk to us about your goals. Book a free consultation, and we will review your site and show you where we would start.
Methods and sources
Blog pageview targets and actuals (1,088 against 1,025 in FY 25, and 1,605 against 1,075 in FY 26) come from Google Search Console data placed into an Excel table. The 3x blog growth and the Careers page peak come from Google Analytics, as reported in the client engagement review.
Click and impression figures (15% sitewide click growth, 500%+ blog impression growth, 46% more clicks) come from Google Search Console for FY 26 (April 1, 2025 to March 31, 2026).
Keyword figures (10x Careers keywords on pages 1 and 2, 50% page 1 growth) come from the engagement review.
Domain Authority (35 to 48) comes from the engagement report, which gives the start and end figures, with Moz as the tool. The quarterly Moz chart behind the image is plotted from the quarterly pulls reported to the client.
LinkedIn figures come from LinkedIn Campaign Manager: Digital Results, October 10, 2025 to April 3, 2026; the previous agency, July 8, 2025 to September 22, 2025. The previous agency’s CPC was not reported. Time on site figures (2 minutes and 59 seconds against 18 seconds) come from the engagement review, measured against a one-minute goal built in as a conversion threshold. The comparison with the LinkedIn industry average benchmark for click-through rate comes from the engagement review.
AI Overview appearances are observed visibility during the tracked period, not a guaranteed or ongoing result.
